Look-to-Book Ratio and 4 Other OTA KPIs for Tour Operators

CEO & Founder
Tour operator since 2012. Runs tours in Kraków, Warsaw and Gdańsk with the Todo.travel group, 100,000+ guests per year.
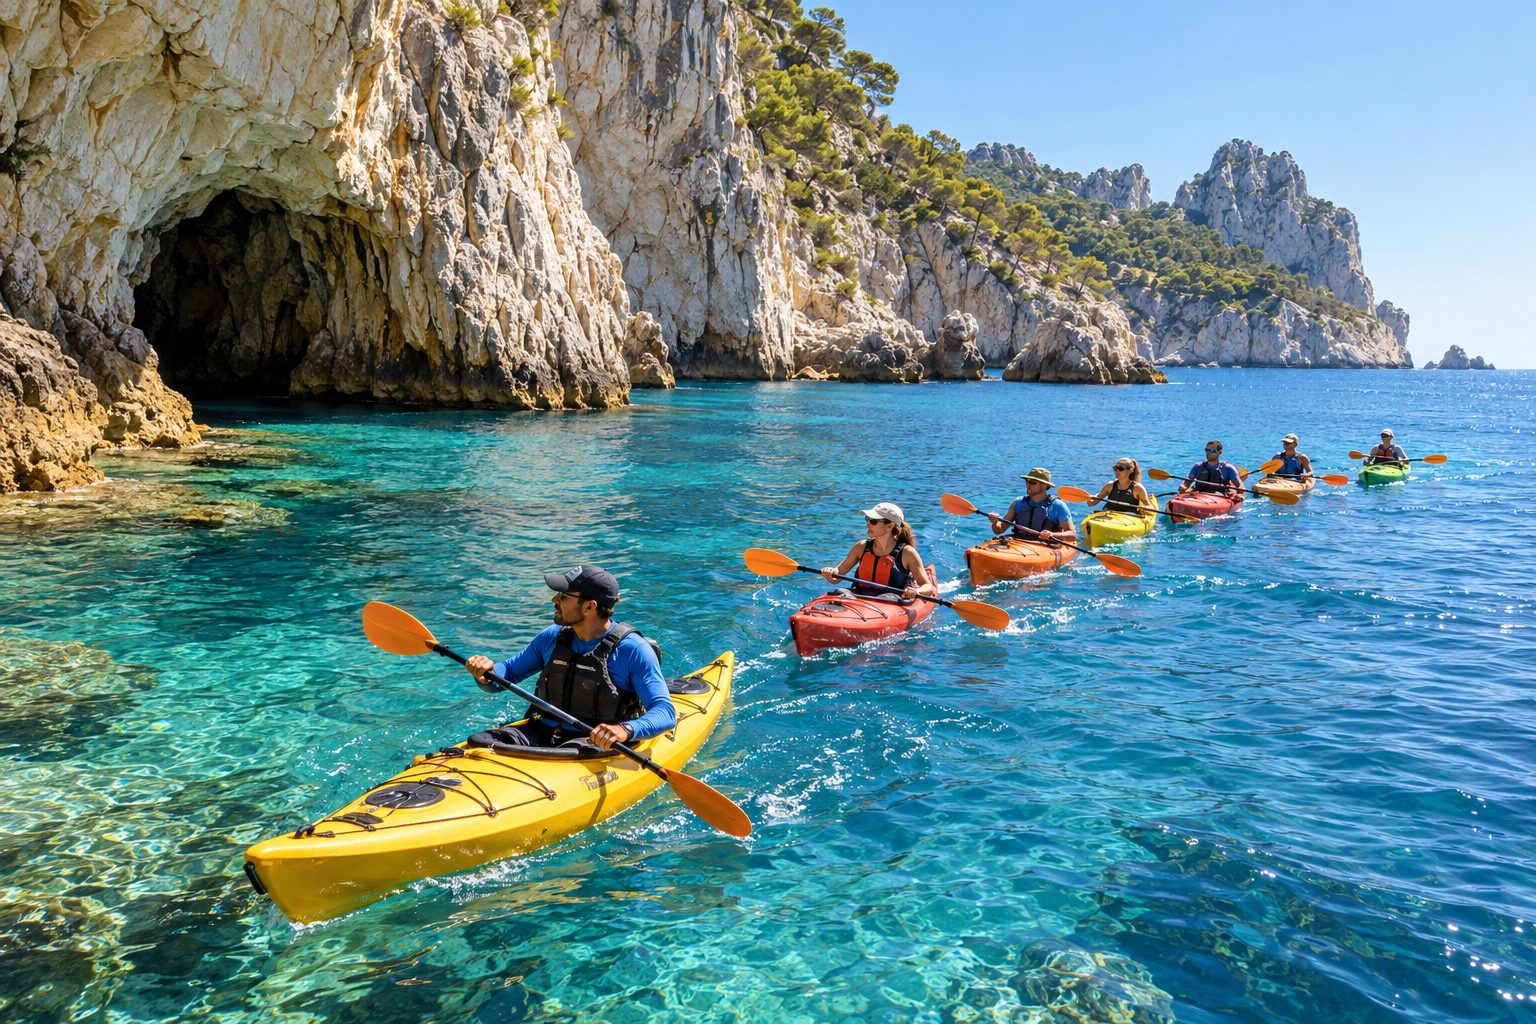
The look-to-book ratio is how many people view your tour on an OTA for every one who books it. Divide listing views by bookings and you have it. Flip the division and you get the conversion rate. On its own, the ratio tells you whether a listing sells. Read next to three other numbers (review rate, the cancellation and no-show rate, and net margin per booking after commission and costs), it tells you what each OTA channel earns you.
Compare channel returns after commission, guide costs and cancellations. For the systems behind those figures, see our tour operator software guide.
Five OTA KPIs That Decide What a Channel Earns
The share of bookings that passes through OTAs keeps growing. Arival's Global Operator Landscape (4th edition, more than 5,000 operator responses) puts OTAs at 37% of 2025 bookings for tours and activities, compared with 33% the year before, while bookings on operators' own websites fell from 29% to 25%. With more than a third of bookings passing through marketplaces, the numbers on those listings decide how much of an operator's gross ends up as margin.
Arival recommends judging OTA distribution by the profitable sales it produces. These five KPIs help you make that assessment.
| KPI | How to calculate it | What it tells you |
|---|---|---|
| Conversion rate | Bookings divided by listing views, per product | Whether the listing turns interest into sales |
| Look-to-book ratio | Listing views divided by bookings | The same signal, read as views needed per sale |
| Review rate | Reviews received divided by completed bookings | Whether your after-tour routine produces social proof |
| Cancellation and no-show rate | Cancelled or no-show bookings divided by bookings made | How much booked revenue never arrives |
| Net margin per booking | Price minus commission, payment fees and tour costs | What the channel leaves you after everyone is paid |
The platforms see the first four and partly rank you on them. Only you can calculate the fifth: the OTA knows its commission, not what your guide, your kayaks or your entry tickets cost.
Look-to-Book Ratio and Conversion Rate: One Number, Two Readings
The look-to-book ratio and the conversion rate carry the same information. A listing with 4,000 views and 60 bookings in a month converts at 1.5%, which is a look-to-book ratio of about 67 to 1. Conversion is easier to chart. Look-to-book is easier to feel: 67 people opened your page for every one who paid.
Is 67 to 1 good? Viator's ranking guide for operators lists page views, click-through rate and bookings as signals. GetYourGuide has shown suppliers conversion rates since March 2024 (as Arival reported), and its Performance section, redesigned in April 2026, lists conversion for every product. Neither platform gives a target. An industry average found elsewhere would blend free walking tours with multi-day trips and city passes, so it says little about your listing. The comparison that works is internal: this listing against your other listings, this month against the same month last year.
Two products on the same OTA show why the split matters (illustrative figures, not a benchmark).
- Listing A: 4,000 views, 60 bookings. Conversion 1.5%, look-to-book 67 to 1. It sells the most, and the page itself is the problem: photos, the first lines of the description, how the price is presented, how many reviews it shows.
- Listing B: 1,200 views, 30 bookings. Conversion 2.5%, look-to-book 40 to 1. The page works. It needs to be seen more: more open dates, the right category, every location the tour visits.
Averaged together, the two look like one listing converting at about 1.7% (90 bookings on 5,200 views), and both problems vanish. Compute the ratio per product and per OTA before you decide where the next hour of listing work goes.
Which OTA KPIs Viator Uses to Rank Tours
Conversion matters for a second reason: Viator ranks on the numbers behind it. Viator's operator guide to ranking and sort (published June 2022, updated January 2023) describes three pillars.
- Relevancy match. Activity category, locations visited, title and description, and personalization to the search: duration, dates, time of day, interests.
- Product competitiveness. Reviews, rating, price, availability, and compensation, meaning the revenue Viator makes from your product. Viator states that agreeing a higher commission will not by itself push a product to the top, but that it is one of many factors.
- Popularity. Click-through rate, page views, traveler searches and bookings through Viator, each judged on recent and historical performance.
Price is one line in one pillar. Most of the list is behavior your listing produces: clicks, page views, bookings and reviews that keep arriving. Set page views against bookings and you have the look-to-book ratio, although Viator does not say how it weighs the two. Its practical recommendations are listing work: at least six photos (two is the minimum), a description of at least 100 characters, availability kept current, its standard cancellation policy and a review request at the end of the tour.
Compensation is where ranking meets margin. Viator Accelerate lets you raise your commission rate in exchange for extra ad placements, including on competitors' product pages and on destination pages, according to Viator's December 2023 description of the program. That can be a good trade. It also lowers the margin on every booking it brings, so judge it on net margin per booking rather than on booking count.
GetYourGuide lists its main ranking parameters in section 6.4 of its Supplier Terms (version of October 1, 2026). Historical performance, including click-through rate and conversion, is named as the most significant one, next to reviews, price, popularity, relevance and post-booking signals such as cancellations. Beyond the terms, GetYourGuide documents the set of numbers it shows you for each product: revenue, conversion, bookings, rating, cancellation rate, no-show rate and source markets. For the listing work that moves these signals, see how to rank higher on GetYourGuide and the OTAs.
Review Rate: The OTA KPI You Move With Process
Review rate is reviews received divided by completed bookings, per channel. On Viator it feeds two factors at once, since reviews and rating both sit under competitiveness. It is also the KPI you control most directly, because the request is yours to make and its timing is yours to set.
Viator is specific about timing: its ranking guide says the recency of reviews is considered and recommends requesting reviews as the experience finishes. It counts reviews submitted on both Tripadvisor and Viator.
Track the rate per channel. A Viator guest and a direct guest are asked through different routes, and one blended rate hides which route is failing. Watch recency as well: a listing whose newest review is from last season reads differently to a traveler scrolling in June. And split the rating by tour and start time, because the headline score is an average and a single departure can drag it down.
The hard part is consistency in high season: the after-tour message has to go out after every departure, the same day, with the right link. In automate.travel that message is a template with variables that sends itself on schedule once switched on, next to the after-booking and pre-tour messages. The request itself is covered in how to get more tour reviews.
Cancellation Rate and No-Shows: Booked Revenue That Never Arrives
A booking becomes revenue once the tour has run and the refund window has closed. Cancellation rate is cancelled bookings divided by bookings made; no-show rate is the same for guests who do not turn up. GetYourGuide now shows both, per product, in its Performance section.
There is no universal normal rate, and the policy you choose shapes it. Viator recommends its standard policy: a full refund for cancellations at least 24 hours before the start, no refund inside 24 hours. Under that policy a guest who cancels three days out costs you the sale and leaves you a seat to resell, while a guest who cancels two hours out gets no refund but still leaves an empty seat. So track two cancellation numbers separately:
- Refunded cancellations remove revenue. They belong in the margin calculation in the next section.
- Late cancellations and no-shows inside a no-refund window are not refunded, but they leave an empty seat, and on a small-group tour sometimes a guide paid for a half-empty departure.
Split both by channel and by how far ahead the guest booked. If one OTA's cancellation rate sits well above the others, check two things first: whether its guests book much further in advance, and whether its listing shows the policy you think you set. Policy wording is covered in our tour cancellation policy template.
Net Margin per Booking After Commission and Costs
This is the KPI that settles arguments about channels, and no extranet shows it, because it needs your costs. Take the price the guest paid and subtract commission or acquisition cost, payment fees and the tour cost. Multiply by the share of bookings that survive cancellation, and you have what a booking on that channel is worth.
A worked example, using our own assumptions rather than a study. A three-hour sea-kayak tour at €70 per person, two guests per booking on average, so €140 per booking at the same retail price on every channel. Running the tour costs €45 per booking (guide share, equipment, insurance). The commission and cancellation rates are invented for the illustration. Put yours in their place.
| Per booking | OTA A | OTA B | Your website |
|---|---|---|---|
| Booking value | €140 | €140 | €140 |
| Commission or acquisition cost | 25% = €35 | 20% = €28 | €15 ads + 3% payment fee = €19.20 |
| Tour cost | €45 | €45 | €45 |
| Net margin per completed booking | €60.00 | €67.00 | €75.80 |
| Refunded cancellation rate | 10% | 18% | 6% |
| Net margin per booking made | €54.00 | €54.94 | €71.25 |
OTA B looks cheaper on commission and ends up level with OTA A once its higher cancellation rate is counted: €54.94 against €54.00 per booking made. The website comes out ahead, but only because the €15 acquisition cost is an assumption, so check your real cost per direct booking first. The example also simplifies tour costs. A guide is paid per departure, not per booking, so a half-full departure carries a much higher cost per booking than a full one. That is why margin has to be measured per tour first, then per channel.
Hard rule
Judge a channel by what one booking made there leaves you after commission, tour costs and refunded cancellations. Booking count tells you how often that happens, not whether it pays.
Commission rates are covered in how OTA commissions work, costs in tour operator profit margin.
Where the numbers live, and where automate.travel fits
The inputs for these KPIs sit in different places: views, conversion and ratings in each OTA's supplier portal, bookings and cancellations in your booking engine, guide pay and tour costs in payroll and invoices. automate.travel is an operations platform that works next to the booking engine. It is not a booking engine and does not sell online: the engine sells the tour, automate.travel runs what happens after the booking. Bookings arrive automatically from Bókun, FareHarbor and Ventrata. Bookings from marketplaces connected to those engines arrive with them in one booking timeline (more in every reservation in one place).
On the money side, it shows margin per tour (revenue minus costs), works out what each guide is owed and runs a monthly OTA settlement panel with currency groups. You compare recorded or imported payouts with the expected amounts and inspect discrepancies, rather than assuming every payout arrives automatically. This provides payment context alongside the cost and margin of each departure. When you assign a departure, each guide's availability and rate are in view; the office decides who is asked or assigned, and the first guide to accept takes the tour. See finance and analytics for the detail.
Pricing is €1.50 per completed booking, with progressive rates down to €0.55 above 60,000 bookings per year. Starting-payment terms depend on the onboarding offer. You pay for tours that ran, and cancelled and refunded bookings cost €0 (see pricing). What booking engines charge is in the booking engine pricing comparison for the engines covered there. Book a demo and we will walk through margin per tour and the monthly OTA reconciliation on demo data.
Frequently Asked Questions
What is the look-to-book ratio for tours?+
It is the number of people who view your tour listing for every one who books it. On an OTA, divide the listing views by the bookings for the same product and the same period. A listing with 4,000 views and 60 bookings has a look-to-book ratio of about 67 to 1.
How do you calculate the look-to-book ratio?+
Look-to-book ratio = listing views divided by bookings, for one product on one channel over one period. Use the same date range for both numbers and keep each OTA separate, because each platform counts its own views.
Is the look-to-book ratio the same as conversion rate?+
They carry the same information read in opposite directions. Conversion rate is bookings divided by views, shown as a percentage. Look-to-book is views divided by bookings. A 1.5% conversion rate equals a look-to-book ratio of about 67 to 1.
What is a good look-to-book ratio for a tour on an OTA?+
Neither Viator nor GetYourGuide publishes a target in the supplier material cited here. Conversion depends on destination, category, price and season, so compare each listing with your other listings and with its own history. A rising ratio means more views per booking and warrants investigation.
Which KPIs does Viator use to rank tours?+
Viator's operator guide describes three pillars: relevance to the search, product competitiveness (reviews, rating, price, availability and the revenue Viator earns from the product) and popularity (click-through rate, page views, searches and bookings). Price is one factor among many.
What metrics does GetYourGuide show suppliers?+
GetYourGuide's Performance section shows revenue, bookings, conversion rate and rating for each product in an overview table. The product detail page adds cancellation rate, no-show rate and source markets (GetYourGuide, April 2026).
How do I calculate net margin per booking on an OTA?+
Take the price the guest paid, subtract the OTA commission, payment fees and the tour cost per booking, then multiply by the share of bookings that are not cancelled and refunded.
Which OTA KPI matters most?+
For visibility, reviews and conversion: Viator lists reviews, rating, page views and bookings among its ranking factors, and GetYourGuide reports conversion for every product. For your business, net margin per booking after commission, costs and cancellations, because a channel with high volume can still leave you the least money per booking.
Sources
- Viator Operator Resource Center, Viator's Ranking and Sort Overview (published 30 June 2022, updated 5 January 2023).
- Viator Operator Resource Center, How Viator Accelerate Drives Product Exposure (14 December 2023).
- GetYourGuide Growth Hub, Find Your Best Opportunities Faster: What's New in Performance (30 April 2026).
- GetYourGuide, Supplier Terms and Conditions (version of October 1, 2026, section 6.4).
- Arival, GetYourGuide Unlocked: conversion reporting for operators (19 March 2024).
- Arival, Direct Bookings Dive, OTAs Rise (26 January 2026), discussing the fourth Global Operator Landscape report.
- Arival press release on the Global Operator Landscape 4th Edition, as published by eGlobal Travel Media (23 February 2026).
Your booking engine handles the sale. What handles everything after?
automate.travel consolidates bookings, finances, team scheduling, and guest communication from Bókun, FareHarbor, and Ventrata, in one system.